Anyone can vibe-code a piece of software now. Most of those pieces will have one reader, the person who prompted them, and then they will go dark. Call it 99 percent. That number is a theory. What follows is the arithmetic that makes the theory plausible, and the electricity and water that sit on the other side of it.
The pile
Lovable opened to the public in November 2024. By its Series C announcement on August 12, 2026, people had created more than 60 million projects on it, and the apps built there were drawing more than 900 million visits a month. Divide one by the other and the average project gets 15 visits a month.
An average is a bad way to meet a long tail. Picture a distribution steep enough to match the theory. One percent of the projects, 600,000 of them, take 99 percent of the visits. Each of those averages about 1,500 visits a month, a small product with a real audience. The other 59.4 million projects share the remaining 1 percent of the traffic, which is 0.15 visits per project per month. A builder opening their own page, once, and not coming back. That sketch is compatible with every total Lovable has published. It is a sketch. Lovable has not published the median.
The theory dies the day someone publishes that median and it is a healthy number, a month after creation, from people who did not build the thing. Until then, 99 percent is the right shape to argue with.
The company's own survey pulls the other direction, and it should be quoted. Nearly 8 in 10 of the builders they asked are trying to make a business or a side project they hope to monetize, and more than a third of that group say they are already earning. Hope is a survey answer. Sixty million projects are a census of starts. A crawl published in September 2026 could find on the order of a hundred Lovable-hosted businesses taking Stripe payments. That count is a floor, from one pass over the public web, and "charges a card" is a stricter test than "my household still uses this on Thursdays." A personal tool with an audience of one can be a success. It just does not show up in either number.
Lovable is one factory. v0, Replit, and Bolt have their own piles, and the agent tools developers actually live in, Copilot, Cursor, Claude Code, Codex, do not publish a project count at all. GitHub's 2025 Octoverse put more than 180 million developers on the platform, 630 million repositories in total, and more than 230 new repositories every minute. Nearly 80 percent of new developers turned on Copilot in their first week. Software's default fate was already a quiet repository. Agents made that fate cheaper to reach.
What one reply costs
The number that gets repeated is the cost of a chat reply, and for a chat reply the measurements have converged.
In May 2025 Google instrumented its own serving stack and put the median Gemini Apps text prompt at 0.24 watt-hours, 0.03 grams of CO₂e, and 0.26 milliliters of water. The water is about five drops. The energy is about nine seconds of television. The count includes the accelerators, the host machine's CPU and memory, idle capacity held for the next spike, and data-center overhead. Accelerators were 58 percent of the energy. The same median prompt had gotten 33 times cheaper in energy over the previous year, and 44 times cheaper in Google's market-based carbon accounting. Training, the network, the phone in your hand, and the water used to generate the electricity are outside that boundary.
Epoch AI, working from the outside in February 2025, put a typical GPT-4o reply near 0.3 watt-hours, and a prompt with 100,000 tokens of input near 40 watt-hours. Sam Altman wrote in June 2025 that an average ChatGPT query used about 0.34 watt-hours and about 0.000085 gallons of water, roughly a third of a milliliter, and published no method. The older figure of about 3 watt-hours per query comes from Alex de Vries in Joule in 2023, built on earlier hardware and a much longer answer than a median reply actually is.
A chat reply is the wrong unit for vibe coding. A coding agent re-reads the project on every step.
One abandoned app
Here is one number, built in the open, because everything after this multiplies it.
Epoch's long-input estimate is about 400 watt-hours per million tokens of uncached input. A 2026 study of coding-agent traffic, Requesty's Coding Agent Economy, followed calls through April 2026 and found Claude Code requests averaging about 84,000 input tokens, a cache hit rate around 92 percent, and about 1,549 calls per user per month. A working session in that data runs somewhere in the range of 50 to 200 calls. I take 80 calls as one small app. I take 1,000 tokens of output per call. I assume a cached token costs a tenth of an uncached token. That tenth is the discount prompt-cache pricing uses. It is an assumption about watts, and it should be labeled as one.
For output I use an upper bound. Epoch's whole short query was 0.3 watt-hours for about 500 tokens. Charging all of that to the output gives 600 watt-hours per million output tokens. Real output costs less than that, because the query also had an input. Using the high number keeps the model from flattering itself.
| Piece | Figure | Where it comes from |
|---|---|---|
| Uncached input | 400 Wh per million tokens | Epoch, February 2025, 40 Wh for 100,000 tokens |
| Cached input | 10% of uncached | Assumption, matching prompt-cache pricing |
| Output | 600 Wh per million tokens | Upper bound from Epoch's short query |
| Input tokens per call | 84,000 | Requesty, Claude Code, April 2026 |
| Share served from cache | 92% | Same study |
| Output tokens per call | 1,000 | Round assumption for a coding turn |
| Calls in one small app | 80 | Middle of a 50 to 200 call session |
The arithmetic per call is 6,720 fresh tokens at 2.7 watt-hours, 77,280 cached tokens at 3.1 watt-hours, and 1,000 output tokens at 0.6 watt-hours. About 6.4 watt-hours a call. Eighty calls is 510 watt-hours. Half a kilowatt-hour. About fifteen minutes of a 2-kilowatt oven.
Move the assumptions and the number moves, inside a band. Fifteen ordinary chat prompts, the fantasy of describing an app once, cost about 4 watt-hours. The same 80-call session with no help from the cache costs about 2.7 kilowatt-hours. I carry 0.51 kilowatt-hours as the central figure and keep both edges in sight.
Sixty million of them
Sixty million projects at 0.51 kilowatt-hours is 30.6 gigawatt-hours.
Data centers used about 485 terawatt-hours in 2025, up 17 percent in a year, in the IEA's April 2026 update, Key Questions on Energy and AI. AI-focused data centers grew about 50 percent that year. The base case from there is roughly 950 terawatt-hours by 2030, around 3 percent of world electricity, with the AI-focused share tripling. Five large technology companies spent more than $400 billion of capital in 2025, with another 75 percent increase set for 2026. Power per task is falling fast. The number of tasks, and the share of them that are agents, is rising faster.
Set 30.6 gigawatt-hours next to 485 terawatt-hours and you get about 0.006 percent of a year of data-center electricity. Using the EIA's 2022 average of 10,791 kilowatt-hours per American residential customer, it is about 2,800 homes for a year. A 17 percent rise on a 485 terawatt-hour base is about 70 terawatt-hours of growth in that one year. The whole Lovable pile, at the central estimate, is about 0.04 percent of that growth.
Take the harsh edge, no cache benefit, 2.7 kilowatt-hours a project. Sixty million of those is about 160 gigawatt-hours. Still about 0.03 percent of the 2025 fleet, on the order of 15,000 homes. The conclusion survives the assumption. The graveyard is wasteful one artifact at a time, and it is small on the grid.
The larger term is the habit. A person at the intensity of those Claude Code telemetry users, 1,549 calls a month, lands near 10 kilowatt-hours a month and about 120 kilowatt-hours a year. That is a little over 1 percent of a U.S. home, for one heavy user, every month, whether or not a project survives. Multiply by millions of developers and you can see it in a national chart. Multiply the 60 million finished-and-forgotten projects and you mostly cannot. Training runs, video, and a fleet that stays powered between prompts are what move the IEA's line. Google's 33-fold efficiency gain and Lovable's 60 million projects are the same event seen from two sides. Cheaper inference mints more software that nobody asked to keep.
Water, counted narrowly
Google's 0.26 milliliters sits on the same 0.24 watt-hours. That ratio is about 1.1 liters of on-site water per kilowatt-hour of serving. Applied to the central project, the cooling water is about half a liter. Applied to 60 million projects, about 33 million liters. An Olympic pool holds 2.5 million liters, so the pile is about 13 pools.
That water is what the data center evaporates to keep the machines cool. The water used upstream, at the power plant, is a second account. On a coal or nuclear grid it can be the larger one. On a wind and solar grid it shrinks toward zero. I am keeping the two accounts apart. Folding a 2023 academic estimate into a 2026 agent model and publishing the product as a measurement would be a fake precision.
The bottle-of-water-per-query line is a misquote of a real paper. Pengfei Li, Jianyi Yang, Mohammad A. Islam, and Shaolei Ren, in "Making AI Less Thirsty" (2023), estimated on the order of 500 milliliters across 10 to 50 queries once cooling and electricity-generation water were both included. Per query, that is tens of milliliters, for the models and the grids of that year. Google's five drops and that paper's wider boundary can both be honest. They are answers to different questions.
The ratio that actually hurts
Take the central app. Five hundred and ten watt-hours to bring it into the world. The person who built it uses it for two hours on a laptop drawing 30 watts. Those two hours are 60 watt-hours. Creation was about eight and a half times the electricity of the entire useful life. Then the app is abandoned, and the ratio freezes. No further use arrives to dilute it.
Give the same 510 watt-hours to a tool that 10,000 people run for 100 hours each. That is a million user-hours. The build comes to about five ten-thousandths of a watt-hour per user-hour. You cannot find it next to the laptop. Shared software amortizes the inference until the inference disappears into the cost of simply sitting there and working. One-reader software never gets the chance.
That is the cost of the renaissance. A terrible exchange rate between electricity and use, inside a fleet that is growing for larger reasons.
If the 99 percent theory holds, 99 percent of the 30.6 gigawatt-hours bought an afternoon. The remaining 1 percent can still be the whole point of the technology. Lovable's 900 million monthly visits land somewhere. A few hundred thousand apps with a real audience produce that average and leave the rest dark. The visits rescue the average. They do not rescue the median project.
What the theory is for
A script that reconciles a spreadsheet this afternoon can be worth half a kilowatt-hour even if you never open it again. The value was the job. The software was a receipt. Count that as a win, and let it die on purpose.
The failure is the third category. A private app, stood up because the real product was annoying, used on Tuesday, forgotten by Friday, and still described as a product in the group chat. Agents made that the default, because the cost in evenings collapsed from a week to a session. The electricity moved the other way. A visible share of the cost of making software is now a data center, and for an audience of one that share is most of the energy the software will ever be responsible for.
Build the thing someone else will still be running next year. Or build the thing that finishes today, and delete it from your plans when the job is done. The waste is software with an audience of one, kept alive in your head as if it had a future.
Where the numbers come from
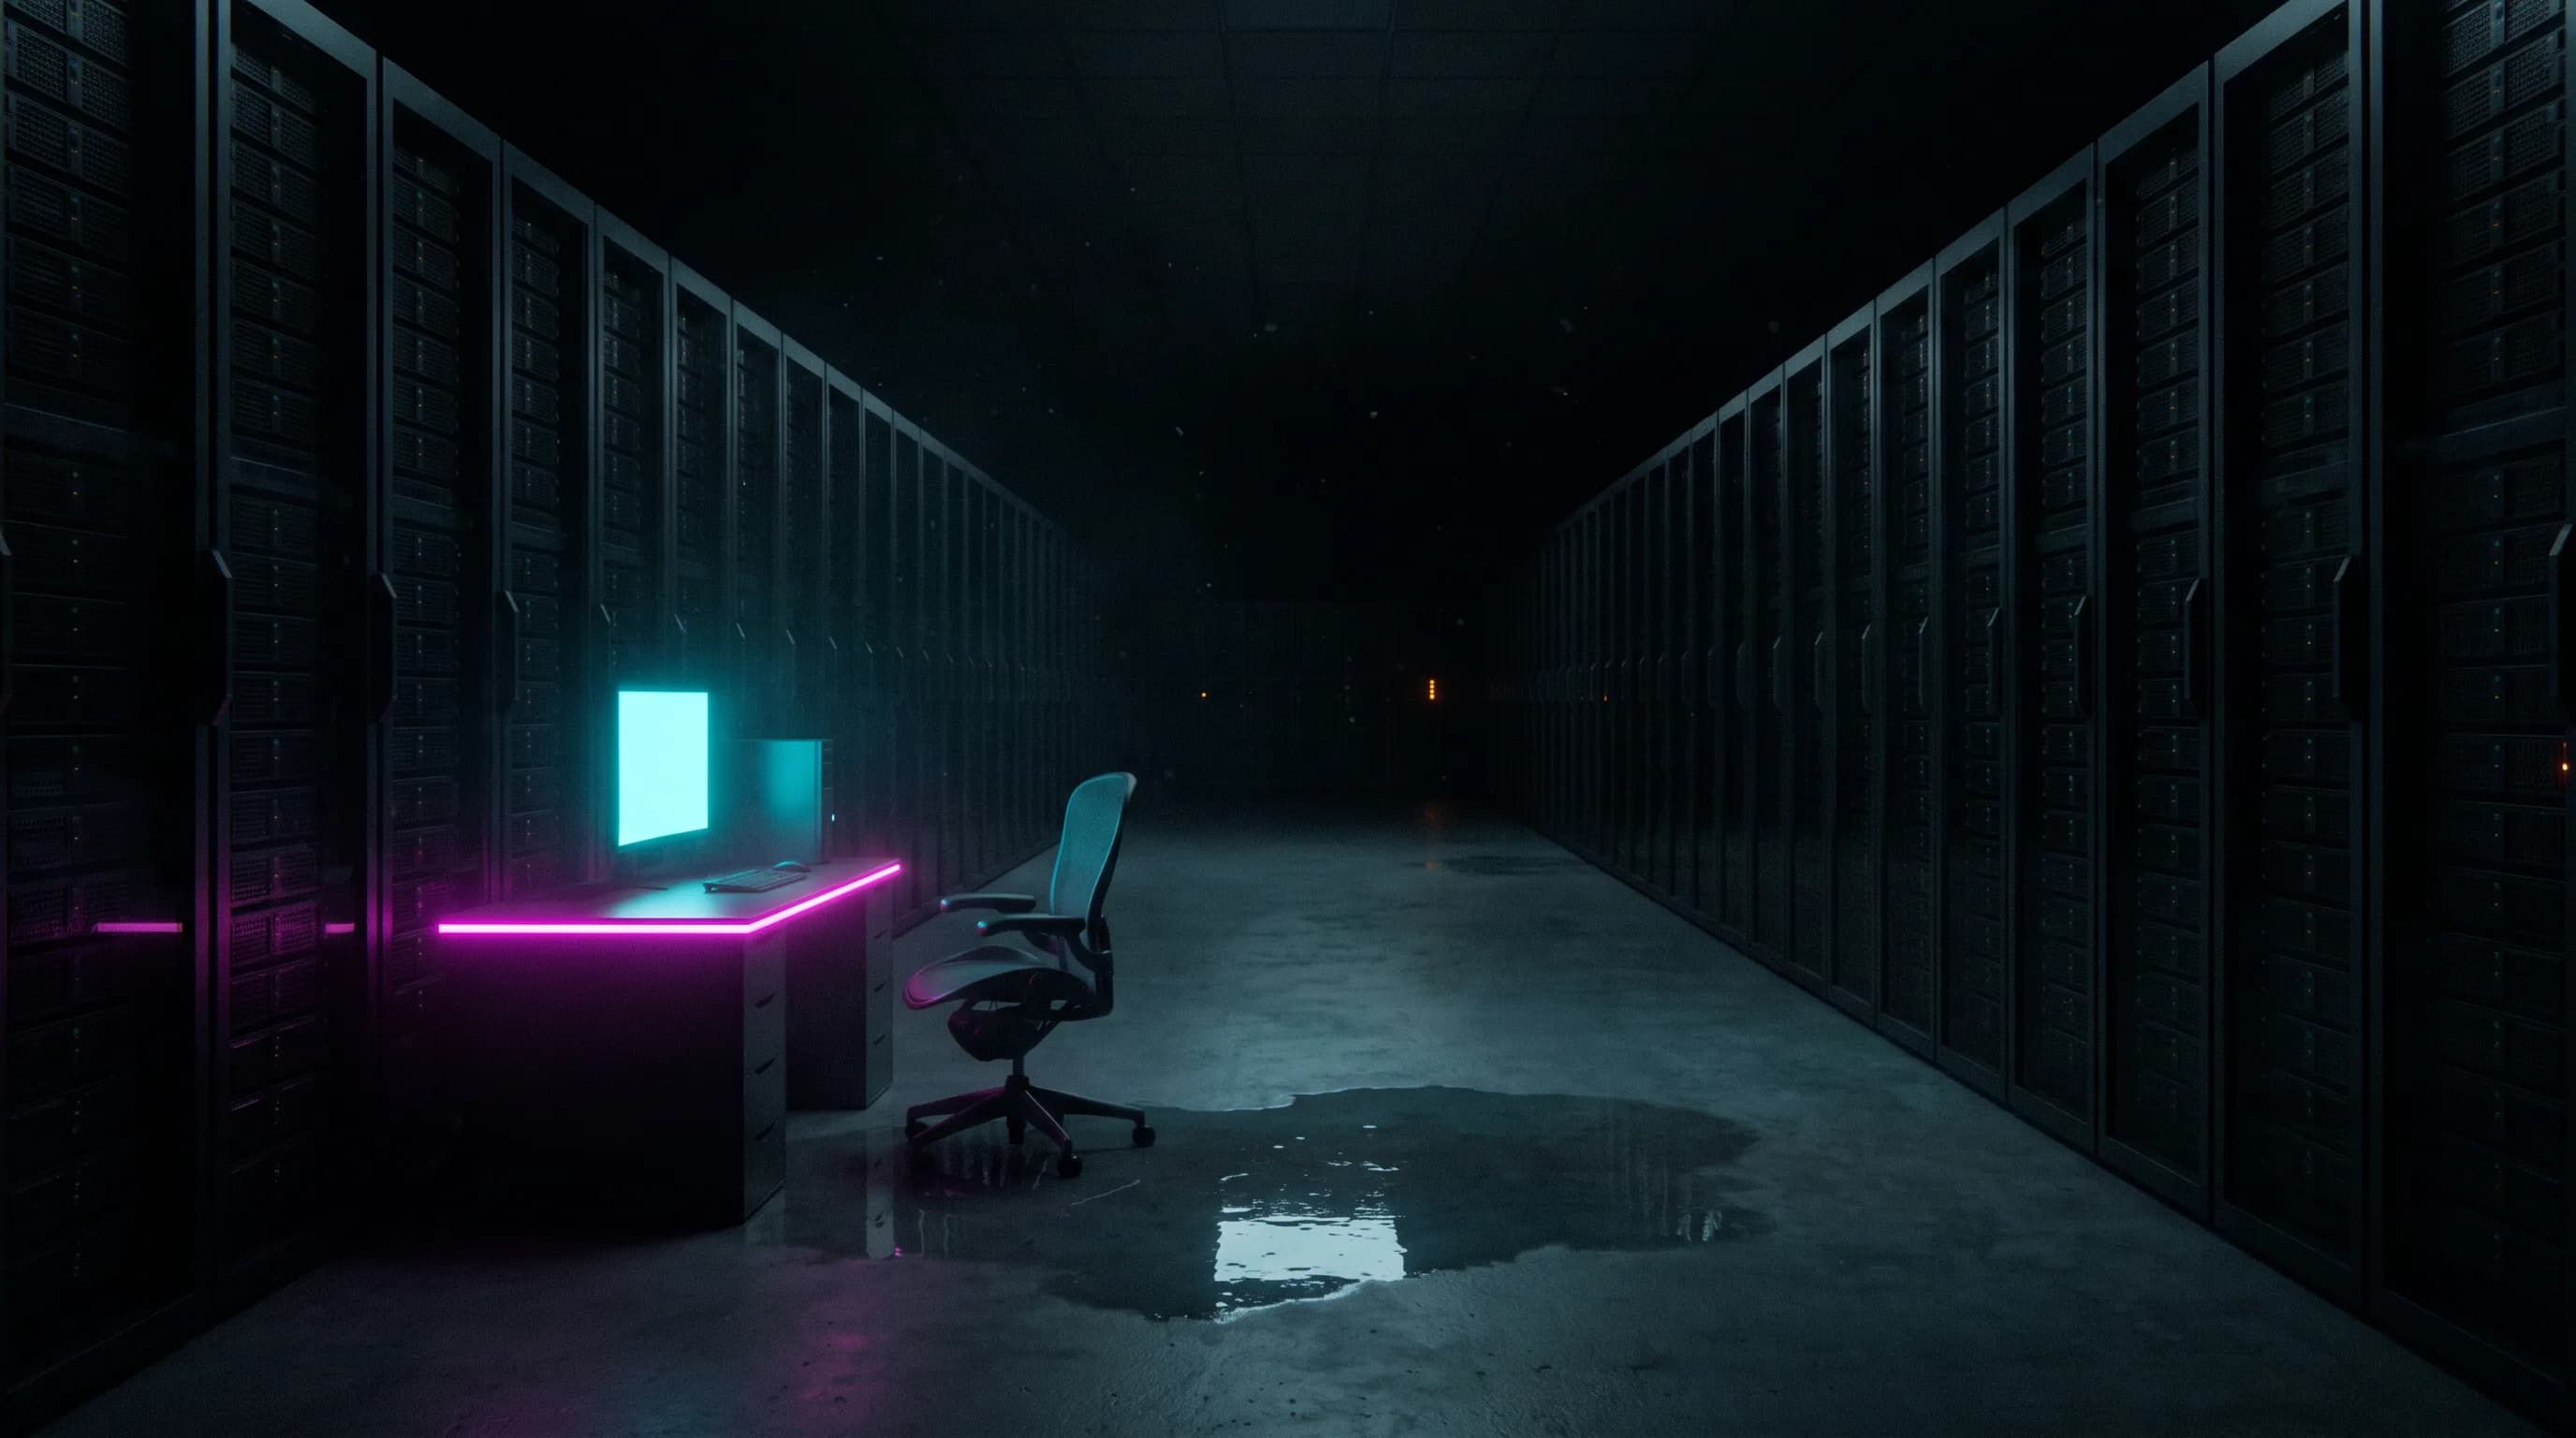
The image at the top of this page was generated for the post with Higgsfield's Nano Banana Pro, a 16:9 frame at 2K. Making the picture was the small part. The model below is the part worth arguing with. An agent helped draft the page. That session belongs inside the same arithmetic.
- Lovable, Series C announcement, August 12, 2026. More than 60 million projects since November 2024, more than 900 million monthly visits, and the builder survey. Reuters reported the same project and visit totals the same day.
- BigIdeasDB, Vibe Coding Statistics 2026, queried September 25, 2026. On the order of a hundred Lovable-hosted businesses taking Stripe payments, inside a wider floor of about 540 across six hosts. A crawl, not a census.
- GitHub, Octoverse 2025. 180 million-plus developers, 630 million repositories, more than 230 new repositories a minute, nearly 80 percent of new developers on Copilot in the first week.
- Google, Measuring the environmental impact of delivering AI at Google Scale, arXiv:2508.15734, August 2025, and the Cloud Blog writeup. Median Gemini Apps text prompt in May 2025: 0.24 Wh, 0.03 gCO₂e, 0.26 mL, full stack. A 33× drop in energy over twelve months.
- Epoch AI, How much energy does ChatGPT use?, February 7, 2025. About 0.3 Wh for a typical GPT-4o query, about 40 Wh at 100,000 input tokens.
- Sam Altman, The Gentle Singularity, June 2025. About 0.34 Wh and 0.000085 gallons per average query. Method unpublished.
- Alex de Vries, "The growing energy footprint of artificial intelligence," Joule, October 2023. The source of the older ~3 Wh figure.
- Requesty, The Coding Agent Economy, data through April 2026. Claude Code call volume, input length, and cache hit rate.
- IEA, Key Questions on Energy and AI, April 16, 2026, and the press release. Data-center electricity about 485 TWh in 2025, up 17 percent. AI-focused data centers up about 50 percent. Roughly double by 2030.
- U.S. Energy Information Administration, average residential electricity use. 10,791 kWh per customer in 2022.
- Pengfei Li, Jianyi Yang, Mohammad A. Islam, and Shaolei Ren, Making AI Less Thirsty, arXiv:2304.03271, 2023. The wider water boundary, and the paper behind the misquoted bottle.
Jordan
AUTHOR